Webserver monitoring
Hi,
In this post I will share about the most commonly used methods by me for the so-called webserver monitoring.
The idea is clear – as a web administrator, it is very important for me to always know what is happening behind the wheel of the web server.
A typical example of the need for monitoring is when our server has lifted a high load, and we need to understand where it comes from.
netstat
netstat is my best friend in such situations. Over the years I have improved in its use and I have found the best combination of parameters with which to easily find out which server my “flood” is.
netstat -tn 2>/dev/null | grep ':80 ' | awk '{print $5}' | cut -f1 -d: | sort | uniq -c | sort -rn | head
And the result is :
[root@web ~]# netstat -tn 2>/dev/null | grep ':80 ' | awk '{print $5}' | cut -f1 -d: | sort | uniq -c | sort -rn | head
47 104.31.11.*
25 86.229.74.*
12 109.133.39.*
12 104.20.209.*
10 94.225.141.*
10 213.219.168.*
7 84.198.179.*
7 81.82.83.*
7 68.180.228.*
7 213.119.25.*
The same combination can be used for port 443 !!
The alternative of netstat is command : ss
When we have IP addresses, you can quickly and easily through whois find out who is coming from where and take appropriate action.
And we can block them :
iptables -I INPUT -s $IP -j DROP
Access Logs
It is very important to properly rely on the logs of the web server. We are often attacked by so-called “bots” that open wp-login.php and try to enter our wordpress. However, each such attempt opens a new request to our php and mysql servers, and “eats” CPU time and memory.
You can read details in my previous post wordpress wp-login.php attack
top, mytop
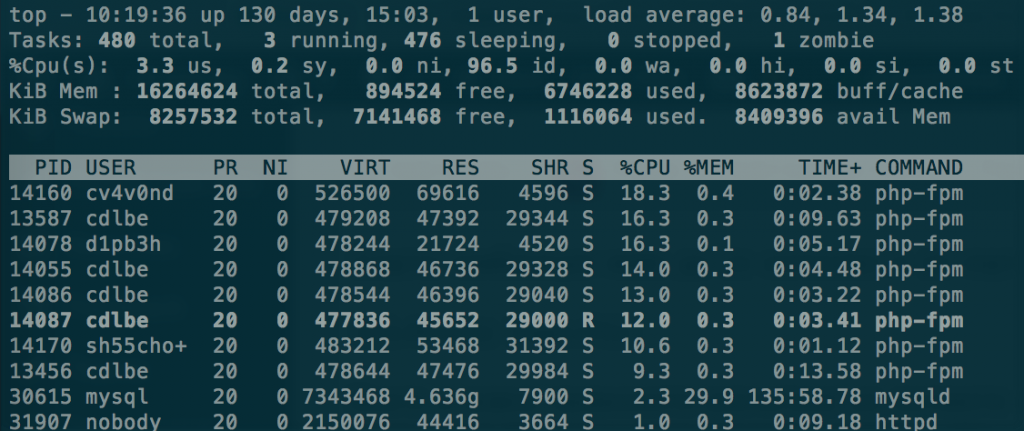
top is the command I use most often for real-time monitoring – it shows me which process loads our server the most and so I can easily find out where to look for the problem.
mytop is an alternative to top specialized in monitoring mysql servers. Through it we can monitor the requests in real time on the machine, as we can kill directly by IDs, monitor replication (if any) and much more!
graphics
Of course, where are we without the graphics.
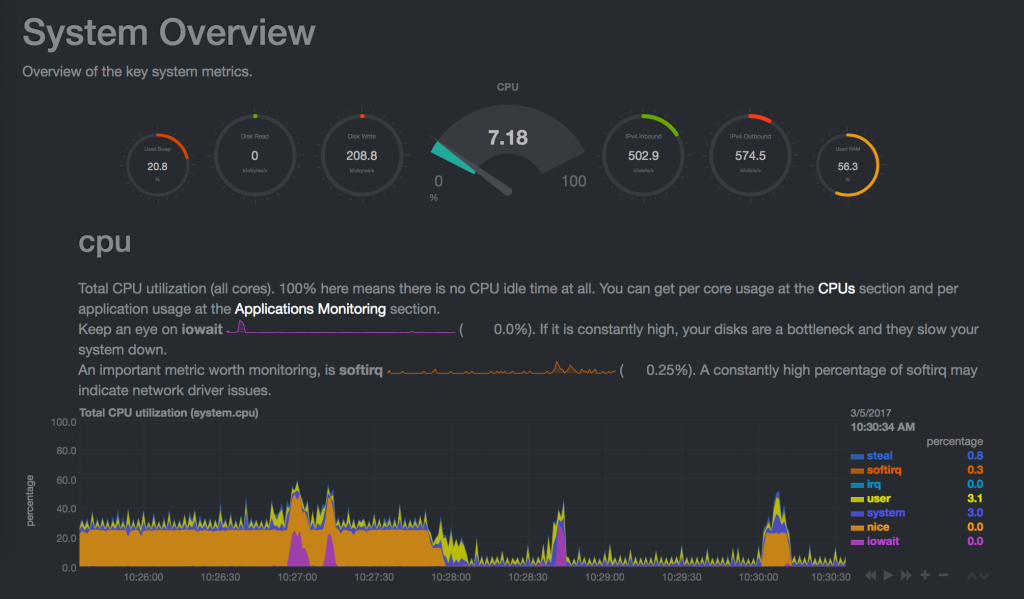
I personally use LibreNMS and Netdata to monitor my servers and draw their graphs.


I used cacti for many years, but for a number of reasons I migrated to LibreNMS (formerly Observium)
Of course, there are many other ways to monitor our web server, but for me the ones listed above are the best.
Here is a link to an article with many useful Linux commands.